
How to Learn Tableau
Have you ever wondered how developers turn data into charts and dashboards? One of the more common solutions used to create such visualizations is Tableau, a visual analytics platform. Tableau makes it easy to present data in a way that people who do not know how to code can understand. This makes insights from data more accessible to others.
In this guide, we’re going to talk about how to learn Tableau and what resources you can use to master it.
What You Need to Know About Tableau
Tableau is capable of producing a wide range of visualizations. To support this, the platform has a lot of features that you may want to learn. We have compiled a list of some of the concepts you should familiarize yourself with as you start learning Tableau:
- Data Visualization: Before you start using Tableau, you should do a bit of research on what data analysis is and why it is used. This knowledge will help you familiarize yourself with the terms you will encounter when you start using Tableau.
- Connecting Data: Once you start using Tableau, you will need to know how to use a dataset. Importing a dataset is called “connecting.”
- Creating a Visualization: You should spend time learning how to create visualizations, such as a pie chart, a bar chart, or another type of graph.
- Designing a Chart: Once you feel comfortable creating a chart, you should learn about the different conventions people use to design them. How big should a chart be? What colors should you use? What text (legend) do you need to add next to a chart?
- Creating Dashboards: A dashboard aggregates views into a single place which you can review at any time. You will want to learn how to create a new dashboard, add views, and arrange it.
- Storytelling: You may be asked to create reports based on the data you have put into a chart. You will need to learn how best to present and describe the data you have put into a graphic so that your visualizations are accessible to the intended audience.
These are only a few of the many things you need to know. As you learn more about Tableau, you’ll become aware of more things you need to know to achieve your data visualization goals.
Skills Needed to Learn Tableau
To learn Tableau, you should have a basic understanding of data analysis and visualization.
While you do not need to be an expert data analyst to use Tableau, knowing a thing or two about analyzing data will help you get used to the jargon and work your way around the features offered by Tableau. Above all, having a mathematical or programming mindset is useful.
Knowledge of SQL, a language used for data analysis and storage, is helpful. You can write your own queries in Tableau which will give you more control over the insights you produce. However, knowledge of SQL is not a prerequisite for using the platform.
Why You Should Learn Tableau
Tableau is widely used in data analysis across different industries. It is an incredibly versatile and powerful tool and companies who need to visualize data know that Tableau is an industry leader. Because Tableau is so widely recognized and accepted, you should have no trouble finding a company that would benefit from your knowledge of the platform.
Knowing Tableau puts another arrow in your data analysis quiver. Even if you are already comfortable analyzing and visualizing data in a programming language, Tableau can make your life easier. It offers a more user-friendly dashboard to create the visualizations you need. Indeed, Tableau has mastered the intricacies of visualizing data, which means that the platform has plenty of features that will save you time.
How Long Does it Take to Learn Tableau?
Expect to spend about a day familiarizing yourself with the basics of Tableau, including how to import a dataset and how to create a basic dashboard. Many developers consider Tableau to be a beginner-friendly tool so you should have no trouble getting started.
However, creating more advanced dashboards on Tableau will take more time to master. Expect to spend a month or two using Tableau to learn the more complex features, which may later become invaluable in your data analysis. As with any skill, the more you practice, the better you will get.
Learning Tableau: A Study Guide
You will find plenty of Tableau learning resources online. With so much information available, you may be wondering where exactly you should start. We have compiled a list of five learning resources that may help you learn what you need to know about the Tableau platform.
Tableau Learning Center
- Resource Type: Course platform
- Price: Free
- Audience: Beginner, intermediate, and expert
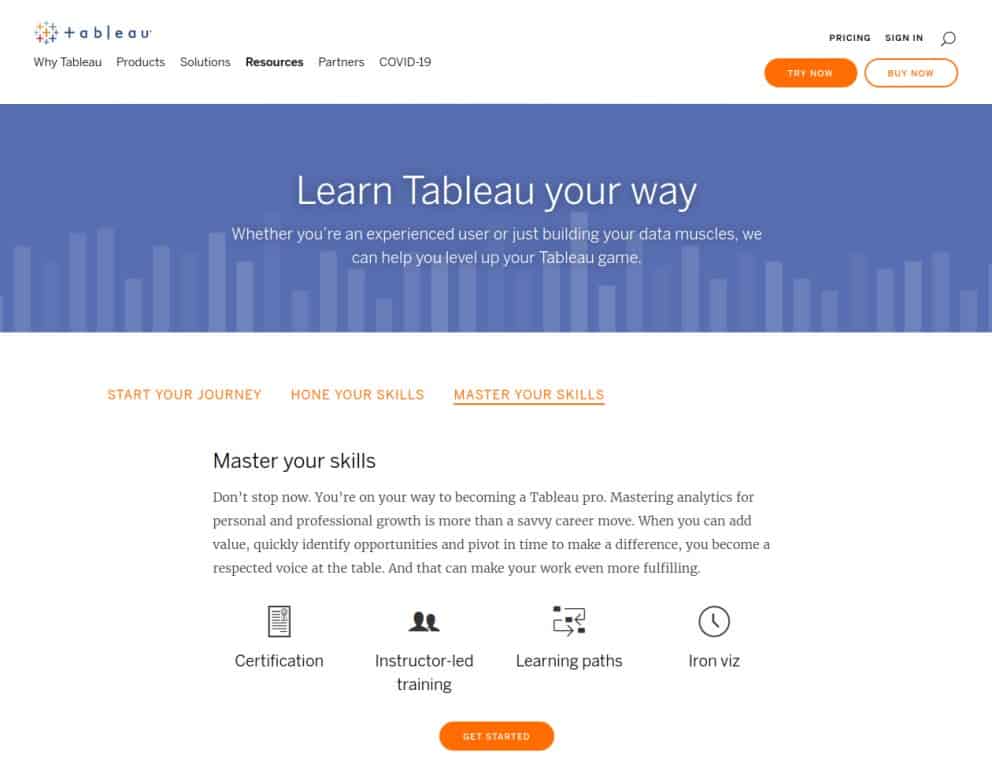
The Tableau Learning Center, maintained by the Tableau team, offers an extensive range of resources that will help you get started using Tableau.
The Tableau team developed these resources, so you know they are high quality and useful. The Learning Center has three learning tracks, each of which offers starter dashboards, how-to videos, and user groups. These tracks were designed to help you start learning Tableau, build your skills, and eventually master the platform.
Data Visualization in Tableau by Udacity

- Resource Type: Course
- Price: Free
- Audience: Beginner
This course teaches the basics of visualizing data using Tableau. It targets people who want to become data scientists or who want to learn more about creating visuals from data.
Over the course of three weeks, you will learn how to tell a story with data and how to best present such data.
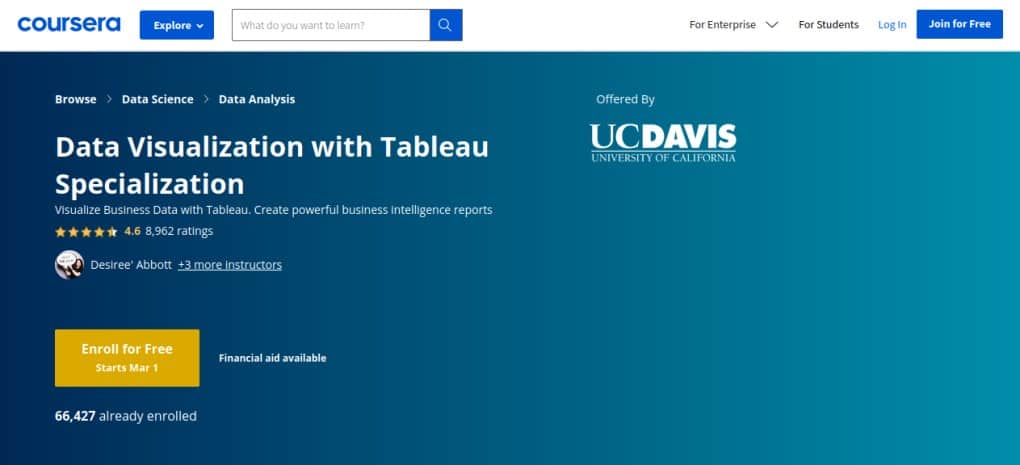
Data Visualization with Tableau Specialization by UC Davis on Coursera
- Resource Type: Course
- Price: Free
- Audience: Beginner
The Data Visualization with Tableau Specialization course takes a look at Tableau from a beginner level, covering how to assess the quality of data, create dashboards, and telling stories with data. This course comes in five modules, starting with the fundamentals of Tableau and culminating in a project where you apply the skills you have learned.
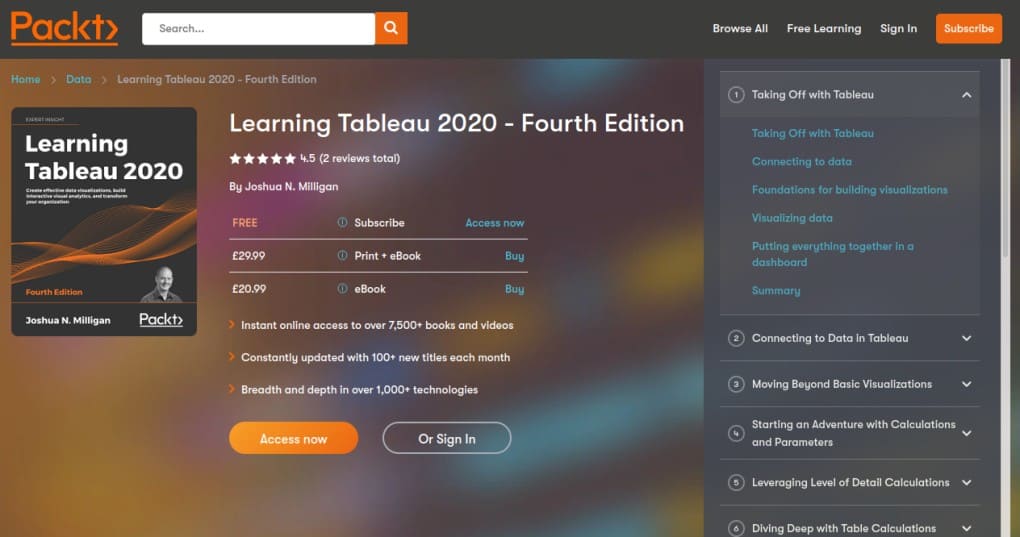
Learning Tableau 2020
- Resource Type: Book
- Price: $27.99
- Audience: Beginner, intermediate, and expert
Revised in 2020, the Learning Tableau is for anyone interested in the platform. The book starts with the basics, such as connecting to data in Tableau and creating basic visualizations. Then, you will explore more complicated topics like using level of detail calculations and telling a data story. By the end, you should be able to produce complex dashboards with Tableau using your own data.
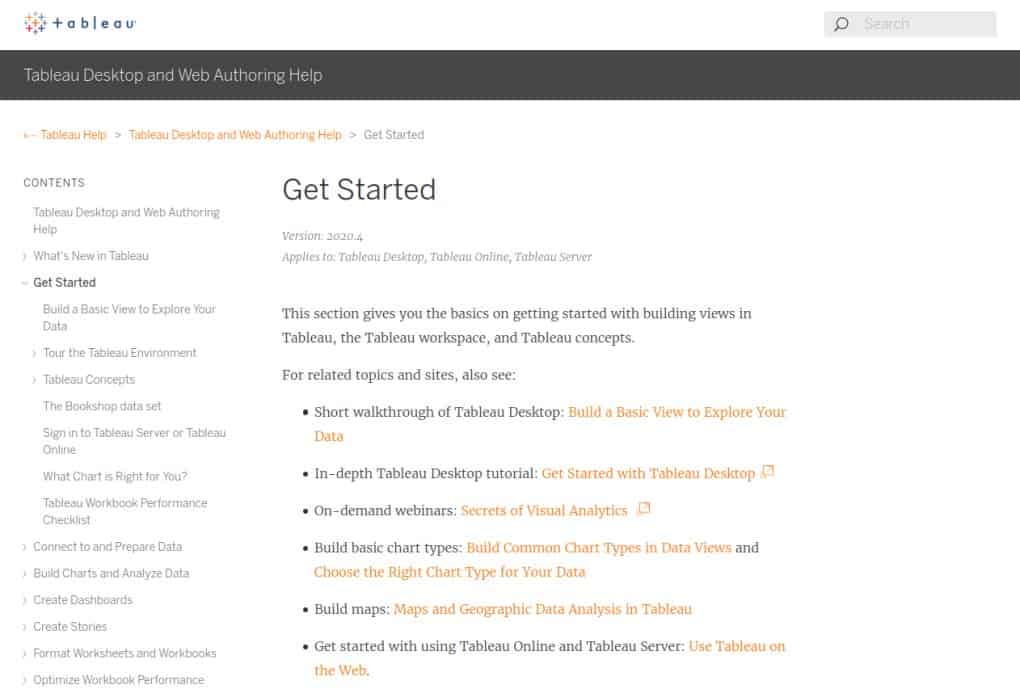
Tableau Documentation
- Resource Type: Documentation
- Price: Free
- Audience: Beginner, intermediate, and expert
The official Tableau documentation is an excellent place to go to learn more about Tableau. The documentation covers all of the main features on the platform. Starting with a helpful Getting Started section, you will find guides on basic concepts and choosing a chart, among other topics. There is extensive documentation on more advanced features you may want to use.
Tableau 2020 Course

- Resource Type: Documentation
- Price: $60.00
- Audience: Beginners
The Tableau 2020 course provides nine hours of video on the basic concepts you need to know. This course requires no background knowledge which means you can dive in without worrying about whether you know enough about data science. The instructor walks participants through topics like creating pie charts, bar charts, using joins, and more.
Communities for People Studying Tableau
Communities are an excellent resource for anyone who wants to learn Tableau. By joining a community, you will be able to find help quickly. You will also be able to learn more about how other people use Tableau, which may inform how you use the tool.
Below we have created a list of some top communities for people studying Tableau that you may want to look at in more detail.
Tableau Community
Run by the Tableau team, the Tableau Community is a hub of knowledge. You will find answers to questions posted by users, example use cases, and more. There is also a user group directory. You can use this directory to find people using Tableau for the same purposes as you.
Tableau Open Source
Tableau has a range of open source extensions that can help you make the most out of the platform. For example, you can find an extension that executes Python code and creates Tableau visualizations, and sample code for the Tableau JavaScript API.
How Hard Is it to Learn Tableau?
Tableau is an easy tool to start using. You could feasibly put together a simple dashboard for some data you have within a few hours without any prior knowledge of the platform. But to use more advanced features and to create more impressive visualizations, you will need to do a lot of research and practice.
Will Learning Tableau Help Me Find a Job?
Tableau is a highly sought-after skill in the technology industry. Employers hiring for data-driven positions like data analyst or business intelligence analyst often list Tableau as an essential skill or an important qualification. To help you understand the value of learning Tableau for your career, we have compiled a few job and salary statistics.
- Salaries: PayScale reports that jobs that use Tableau pay, on average, $75,476 per year. Positions that use this skill include analytics consultant, analytics manager, business intelligence analyst, data analyst, and senior data analyst.
- Job Openings: Glassdoor reports that there are 6,885 jobs in the United States that list Tableau as a requirement. This shows that, with the right set of skills, you should have no trouble finding a company that can leverage your Tableau knowledge.
- Industry Growth: According to the U.S. Bureau of Labor Statistics, operations research analyst positions will grow at a rate of 25% between 2019 and 2029. While not all of these positions will use Tableau, most of these professionals are likely to use data visualization software.
Conclusion: Should You Learn Tableau?
Tableau is a data visualization tool that makes it easy for analysts to present the data they have processed. Using Tableau, analysts can create charts and dashboards to accompany their findings which can be customized in a number of ways.
Tableau is useful no matter what career in data you pursue. It comes in handy whether you want to become a data scientist, a data analyst, or a data engineer. You may even find uses for Tableau outside of a career in data if you need a tool with which to visualize a dataset.
With attractive salaries, strong job prospects, and a shallow learning curve, Tableau has the potential to add a lot of value to your career.