
8 Professional Data Science Tools to Learn
Like any technical job, data science workers have their “tools of the trade”, the technologies that are behind most of their work. As you gain experience working in data science, these tools will become second-nature to you.
But if you are just getting started with data science, you may wonder to yourself: which tools are worth learning? Which tools am I likely to use on the job? Even if you know a bit about data science already, you may be thinking about what other tools you could learn.
Data Science Tools to Learn
We have done some research and found eight wide-spread data analysis tools that are worth learning if you want to become a data scientist:
- Jupyter Notebooks
- MATLAB
- Microsoft Excel
- Apache Spark
- Tableau
- Apache Hadoop
- SAS
- Alteryx
Thinking about what tools to learn before you start learning new technologies, allows you to choose a tool that meets your needs. In this guide, we’re going to chat about seven widely-used tools in the data science industry and how they are used.
Jupyter Notebooks
Jupyter Notebook is a tool that lets you create so-called “notebooks” that contain code, graphs, and the results of data science projects. Powered by Python, the Jupyter tool makes it easy for data scientists to collaborate on studies and see the results of an analysis. You can write code in a Jupyter Notebook using over 100 programming languages, ranging from Julia to Python to R.
Jupyter is used for a number of purposes, including:
- Cleaning data.
- Exploring data.
- Analyzing data.
- Producing visualizations to display findings.
- Explaining code.
All of these purposes are essential in data analysis. For instance, using Jupyter and Matplotlib you could create three charts which explain your main findings after analyzing a dataset. Or you could clean a dataset and show how you did it so that other people can learn from your work.
Jupyter is free and open-source meaning the tool is accessible to any data scientist who is interested in using the technology.
MATLAB
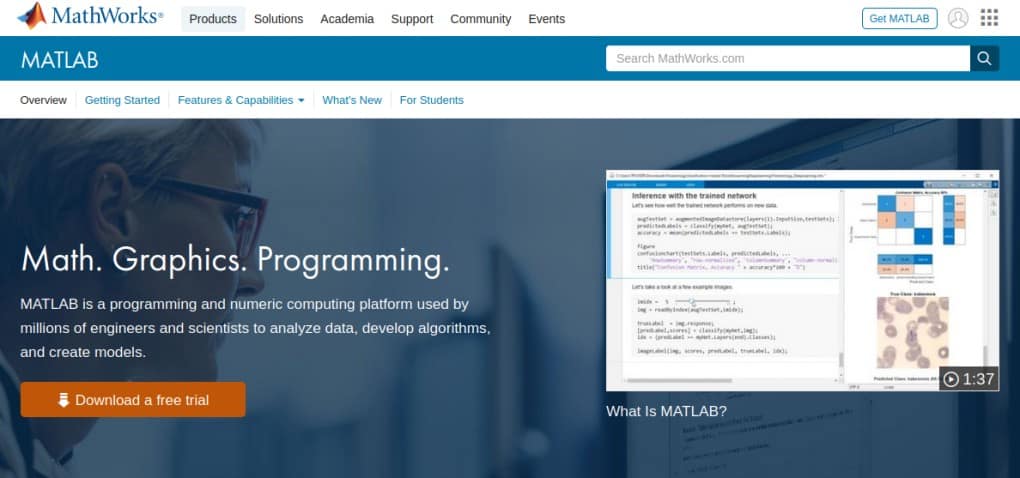
MATLAB is a computing platform and programming language used for data science and mathematical computing. This tool makes it easy for you to analyze data, create models for your data, and draw visualizations which represent your findings. MATLAB is a product by MathWorks and so you must pay to use this tool.
MATLAB is a programming language. The MATLAB language was designed with mathematical and scientific computing in mind, meaning you are likely to find all of the features you need in the language to analyze datasets. But MATLAB can be used with languages like Python and C++ if you want to combine MATLAB with other code.
MATLAB is commonly used in machine learning, deep learning, data analysis, computer vision, predictive monitoring, and robotics, according to their website.
Microsoft Excel
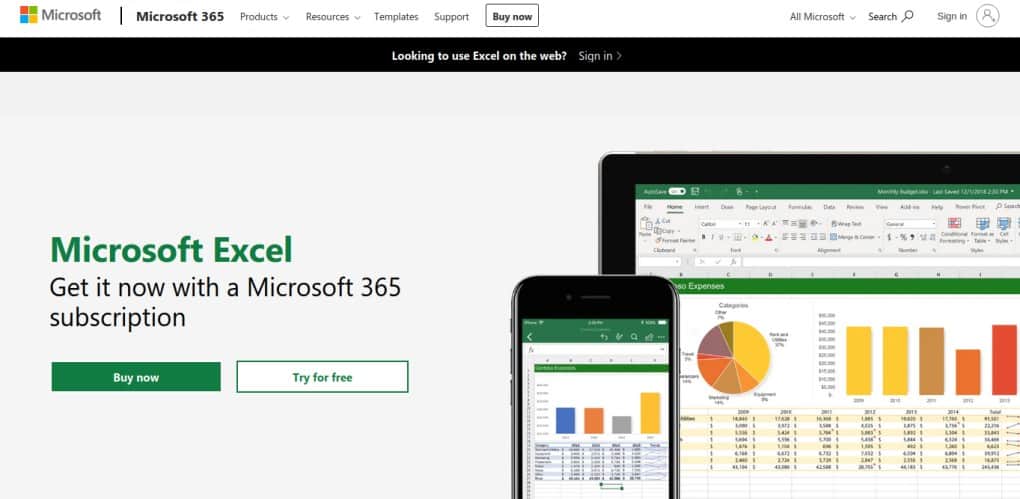
Microsoft’s Excel is a spreadsheet program. This program uses the cells, rows and columns format to store data. Using Excel you can view data, clean data, order data, and produce basic analyses. You can also use Excel’s charting features to create graphs that represent your data.
Excel is widely used because the tool makes essential data science operations quite easy to execute. For instance, the Excel formula feature makes it easy to manipulate the contents of cells and perform mathematical operations. Using similar formulas in a programming language would probably take more time to plan and implement. Drawing charts of a dataset may take many lines of code in a programming language. You can draw charts in Excel using a visual interface.
Microsoft Excel is not ideal for larger datasets or more complex analyses. But for smaller and more basic analyses, a data analyst may be able to do most if not all of the work they need to do finside of Microsoft Excel.
Apache Spark
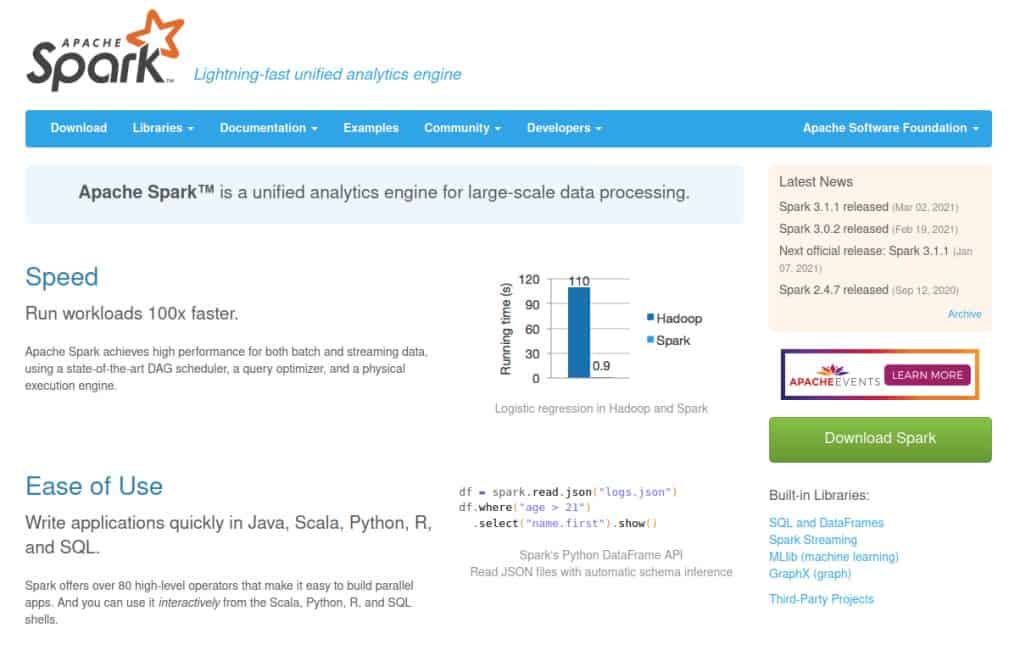
Apache Spark, created by the same organization as the Apache web server, processes data at scale. Spark is commonly used in the big data industry due to its speed and intuitive nature. According to Spark, you can write code in languages like Scala, R, and Python alongside your Spark programs, meaning you can easily build onto your Spark infrastructure.
Spark makes it easy for developers to build models and clean data. The tool is particularly useful if you are working with big data — massive datasets that may be constantly changing — which is the purpose for which the tool was written.
Tableau
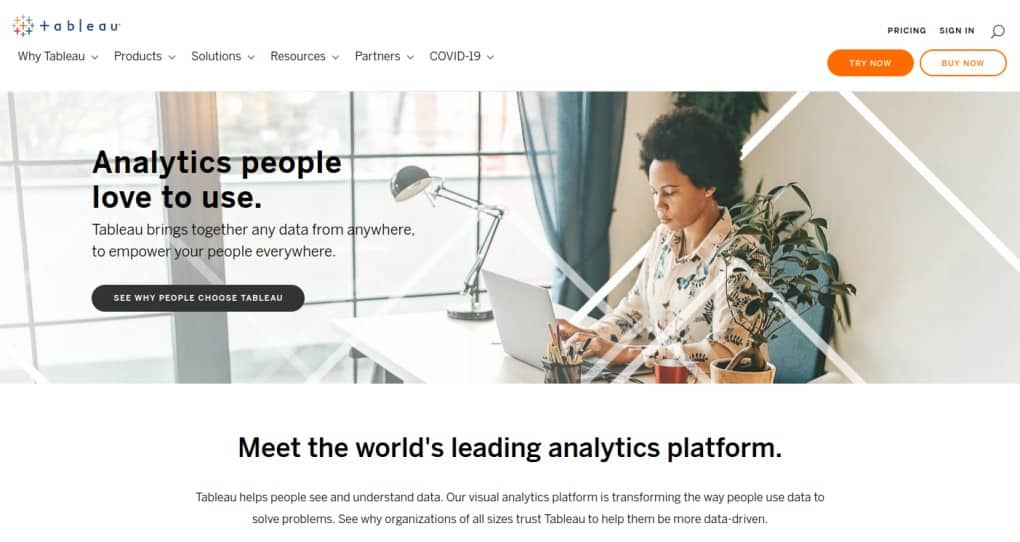
Tableau is a data visualization tool accessible on the desktop or in a browser. Using Tableau, you can find insights in your datasets and plot those insights into custom charts and tables. You can connect to various data sources like a spreadsheet or one of the various platforms from which Tableau can retrieve data.
Tableau is a drag-and-drop tool which means you do not need to have any programming experience to use the tool. And because you can connect to data sources directly, you do not need to worry about having to write custom programs to receive data.
Tableau makes it easy to build dashboards that aggregate graphics and charts into a single place. These dashboards are useful in a number of business cases. For instance, a business may produce a dashboard which features all of their key performance indicators they want to track. This dashboard would be in one place so those who need to view the dashboard would not have to look around at multiple sources to find the chart for which they are looking.
Apache Hadoop
Apache Hadoop is a tool for distributed computing. Hadoop was designed for distributing complex data processing systems, meaning you can process data on multiple computers instead of just on a single server. Apache Hadoop can scale to thousands of servers, meaning there is plenty of room to expand your infrastructure when you need to do so.
Apache Hadoop comes in five modules, each of which serves a unique purpose. For instance, Apache YARN lets you schedule jobs and manage your cluster. MapReduce lets you process large data sets in parallel. Ozone stores objects for Hadoop. You can find out more about these modules on the official Hadoop website.
SAS
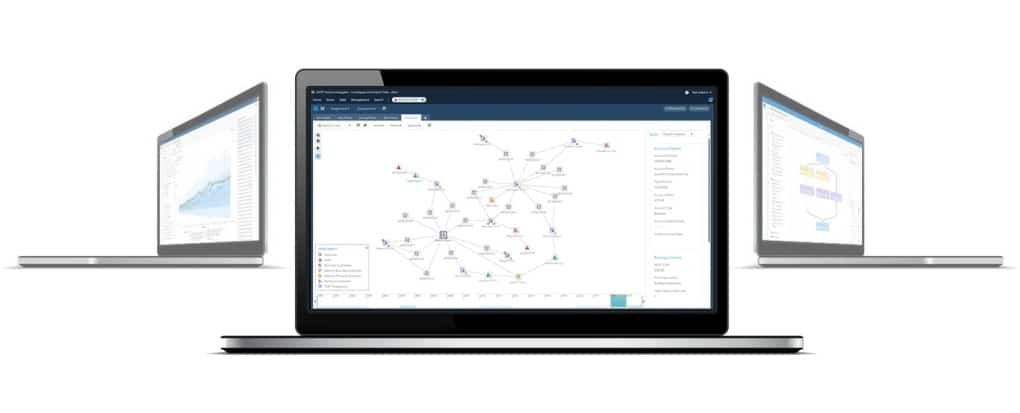
SAS is a tool for data analytics used widely by businesses. You can use SAS to analyze data, create reports, and make forecasts based on the data you have. SAS is commonly used because it has a wide range of features useful when working with data and brings those features into an intuitive interface with which you interact.
You can import data from various formats into SAS. Using your data, you can apply mathematical and statistical analysis techniques to derive insights. You can also prepare a visual report with graphics that displays the outcome of your analysis.
According to SAS, “91 of the top 100 companies on the 2019 Fortune 500 list” use the SAS tool, which shows how wide-spread this technology is. SAS is used in fields like banking, consumer goods, manufacturing and insurance.
SQL
SQL, or Structured Query Language, is used for managing data in a database. This technology lets you create, manipulate, and delete records in a database. You can also change the structure of a database. SQL is an international standard and is used in a range of database technologies, from PostgreSQL to MySQL.
SQL is used in a range of applications. For instance, you could use SQL to:
- Store the purchases made by users on an e-commerce platform.
- Keep track of achievements earned by a gamer on a multiplayer online game.
- Store employee records.
- Keep track of posts on a blog.
SQL is one of the most important skills to have as a data scientist. You will almost certainly be asked at some point to work with a database that uses SQL, even in the most advanced data science jobs. With that said, SQL is considered quite easy to learn so getting started with.
Choosing a Data Science Tool to Learn
There are plenty of data science tools out there, with good reason: data science is a complex field and there are a lot of different ways in which data can be processed and analyzed. No one tool will provide every feature a data scientist needs to do their job.
Choosing which data science tool to learn can be difficult because there are so many. To help you choose which tool to learn, consider these questions:
- What do you need to do? Visualize data? Create dashboards? Process big data?
- Do you want to learn how to use a data science tool for a personal project or do you plan on becoming a data professional?
- How much are you able to spend on a tool? (Note: You should consider this question if you are working for a business and want to learn a new tool, rather than if you want to learn a new tool as a hobby. Some tools can get quite expensive.)
These questions will help you figure out what tool you should consider learning. For example, Tableau is a great tool for creating dashboards. Apache Spark is good for processing big data. Jupyter Notebooks is good for sharing insights from a data analysis in Python.
Whatever tool you choose to learn, we wish you luck on your journey to mastering that tool.


