
7 Data Analysis Tools Used in the Industry
With so many data science and analysis tools on the market, you may be wondering which ones deserve your attention and which are worth learning about. These are excellent questions and deserve a good answer.
In this guide, we’re going to discuss seven of the most important data analysis tools used by data professionals. We will explain what each tool is used for, why they are important, and their main features. This guide will help you understand what tools matter the most in the data analysis field.
The R Language
R is a programming language used for statistical computing and data science. R makes it easy to clean and analyze large datasets. You can also create visualizations using the R language to convey your findings after you have analyzed a dataset.
The R programming language is based on S, another statistical computing language. While R does not have the most intuitive syntax in the world, the language is incredibly flexible, offering an extensive range of features that are useful in data analysis.
For instance, using R you can:
- Conduct a regression analysis
- Calculate the standard deviation of a dataset
- Remove erroneous values from a dataset
- Perform statistical analyses like calculating interquartile ranges
R is one of the go-to languages for data analysis.
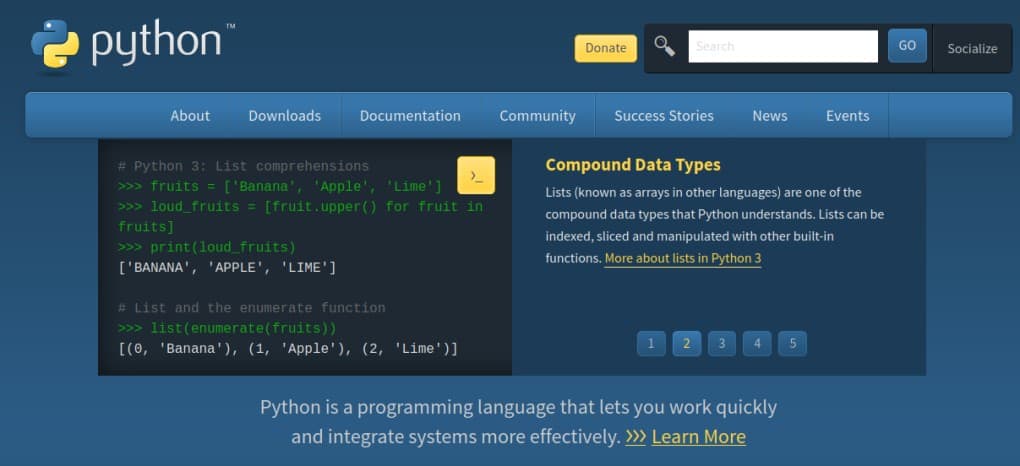
Python
Python, which was initially developed by Guido van Rossum, is a general-purpose programming language. It has an intuitive syntax and is easy for beginners to learn. In the context of data science, Python shines due to its extensive range of packages.
For instance, NumPy makes it easy for data scientists to work with arrays, a common data type used in data analysis. Matplotlib makes it easy to create charts and graphs using data you have processed. However, Python by itself, without any packages, is useful for data analysis—you can easily clean and process data using regular Python.
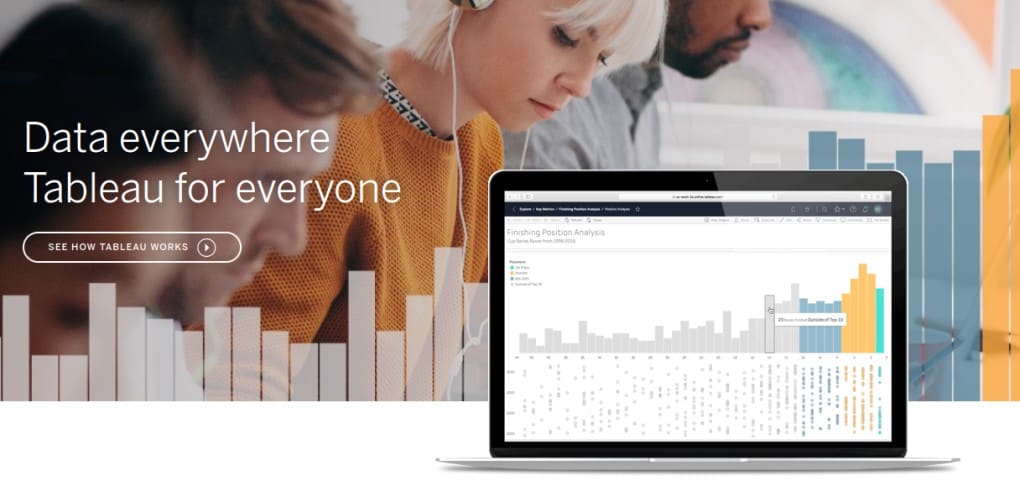
Tableau
Tableau is a data visualization tool. Founded in 2003, Tableau gives data analysts a lot of control over how they present data. You can use this platform to create charts, graphics, and dashboards that consolidate multiple insights.
Tableau, unlike many other data analysis tools, can be used by people with no technical programming background. While Tableau takes a while to learn, it allows you to create detailed visualizations without coding knowledge. For instance, using Tableau you can create:
- Bar charts
- Heatmaps
- Maps of the world
- LIne graphs with trend lines
- Complex tables
These are only a few of the many graphics you can create with Tableau, which shows how powerful this technology can be for data analysis.
Microsoft Excel
Excel is an incredibly flexible piece of software and comes up a lot in data analysis. Excel makes it easy to create basic charts, derive insights from data, and view datasets that you plan to analyze. Excel stands out in the data analysis industry because you do not need any programming experience to use it.
Using Excel, you can perform tasks like:
- Creating pivot tables to learn about data
- Creating charts from your data
- Creating filtered views that only show certain data
Excel is a very convenient tool. Tasks that could take hours to do in a programming language can be performed in Excel much faster. In addition, because the software is visual, Excel documents can easily be shared with non-technical people so they can give feedback.
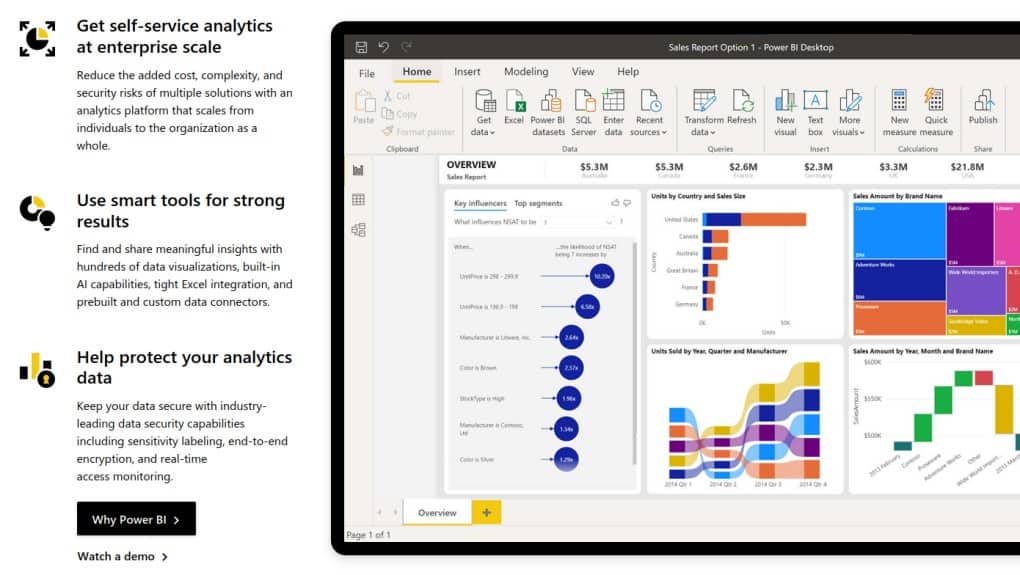
Power BI
Another tool by Microsoft, Power BI (Business Intelligence) is used for analyzing and visualizing data. Businesses use Power BI to make better use of the data they have collected. For instance, a company may use Power BI to track key performance indicators or to find answers to important business questions.
Like Tableau and Excel, Power BI does not require any programming experience. An important feature of Power BI is that you can create visual insights that integrate with other Microsoft tools. In other words, you can share what you have made in Power BI using tools like Excel and Teams, which makes it easy for people to collaborate on data analyses.
SAS
SAS, or Statistical Analytical System, is a complex analytics system developed in the 1960s and 1970s. While older than other tools in this list, SAS plays a key role in many data analysis setups today.
SAS helps businesses make use of their data in their decision-making processes. The tool is known for being intuitive—as long as you know a bit about data, you should have no trouble getting started with this tool.
Like Excel, SAS is a paid tool, which means you must have a subscription to use it.
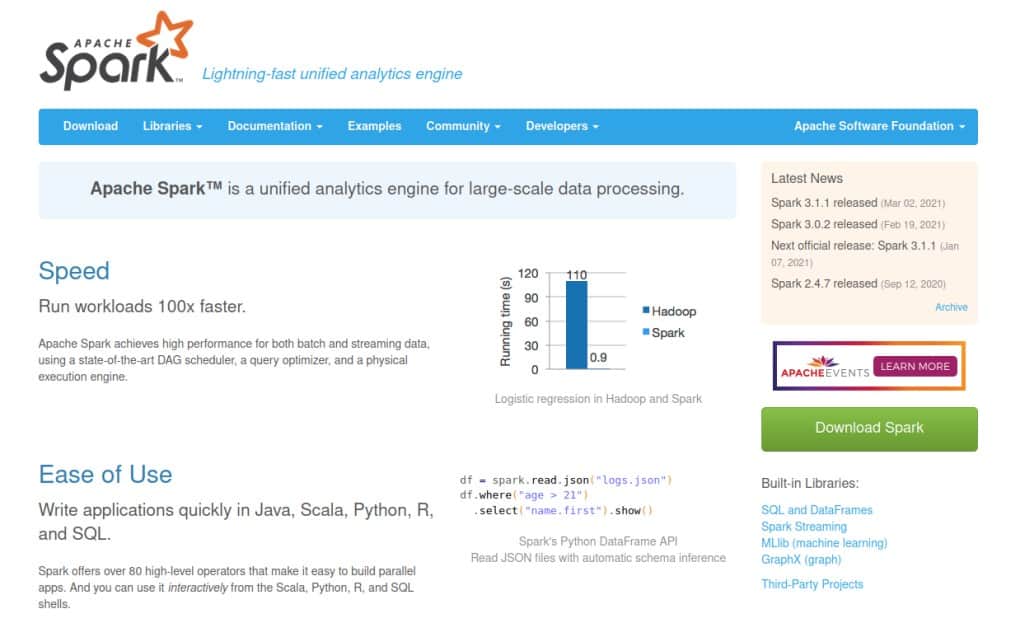
Apache Spark
Apache Spark is used for analyzing and processing big datasets. This tool can handle datasets that are much larger than average and even datasets that are continuously changing. Apache Spark is open source and integrates with many tools like SQL and Python to give you more control.
Apache Spark is commonly used in larger organizations that work with high volumes of data. For instance, social networks find Apache Spark useful because they collect a lot of data. Companies like Amazon, eBay, Groupon, and Soho all have Spark as part of their data analysis toolkit.
Data Analysis Tools: Which Should You Learn?
All of the above tools are used in data analysis. Deciding which one to learn requires careful consideration because all of them take considerable time to learn. Even learning how to use Excel for data analysis takes time. Before you make a decision, there are a few questions you should ask yourself:
- Do I want to code?
- Do I need to create dashboards?
- Does the tool fit in with my workflow?
- Does the tool often come up in the career path I have in mind?
These questions will help you decide which tool is best. For instance, if you want to code and become a data analyst, learning R or Python is a safe bet. However, if instead of writing code you want to create dashboards, Tableau or Power BI may be better.
The technologies we have discussed will help you advance in a career in data science. Choose the tool that best suits you and that you can see yourself using often. Good luck in your learning journey!